Urban Score
Measuring your relationship with the city
The experience of sensor rich mobile devices will not be that of communication tool but as measurement instrument. How can such devices measure the visible and invisible components of an abstract value such as “urban-ness”. Similar to a dosimeter that is used to measure exposure to radiation, how can we measure and render visualizations of our own dynamic “dose of the city” - our urban score.
Measuring familiar strangers (bluetooth), friends (bluetooth), distance from “city center” (GPS), air quality (onboard atmospheric sensors), nearby traffic patterns (RSS feeds), etc. a “score” is determined and displayed as a personal steganography visualization. The name comes from steganography which is the art and science of writing hidden messages in such a way that no one apart from the intended recipient knows of the existence of the message. A typical steganographic application is to hide messages within images via altering low order bits of pixels, etc. In our approach we alter small portions of what appears to be an ordinary image. The alterations are subtle and occur over long periods of time making them hardly perceptible to the casual untrained glancer. However, to the intended recipient who knows how to read the display, a wealth of information is stored within it. Below are mobile phone screens depicting urban score.
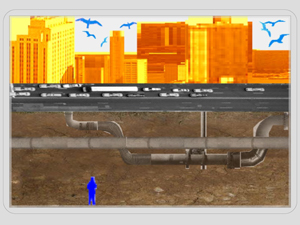
PHOTO REALISTIC
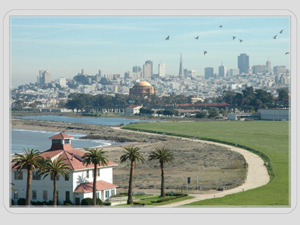
Birds represent nearby
Familiar Strangers

People on path
represent nearby friends
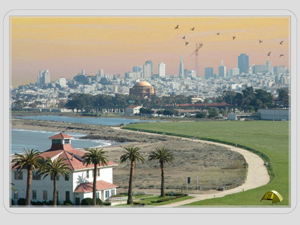
Other examples:
Sky color
Crane in city
Yellow Tent
ICONIC
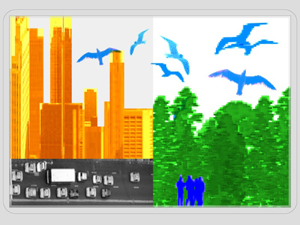
Approaching city from suburbs
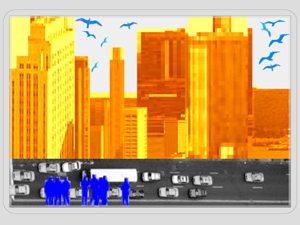
Birds, people, buildings, traffic in the city
Under the city on a subway
Team
Eric Paulos
Ian Smith
Ben Hooker