Citizen Science
Below is a brief description of the Common Sense Reseach Project. You should check the main Common Sense Project Website for live and up to date information:
Team (alphabetical):
- Paul M. Aoki (Intel Research Berkeley)
- R.J. Honicky (U.C. Berkeley)
- Ben Hooker (Art Center College of Design)
- Alan Mainwaring (Intel Research Berkeley)
- Chris Myers (Isopod Design)
- Eric Paulos (Intel Research Berkeley / CMU)
- Sushmita Subramanian (Intel Corporation)
- Allison Woodruff (Intel Research Berkeley)
With support and collaboration from:
- Intel Research
- City of San Francisco: Office of the Mayor
- City of San Francisco: Department of Public Works
- City of San Francisco: Department of the Environment
- Prof. Eric Brewer (U.C. Berkeley)
- Prof. John Canny (U.C. Berkeley)
- Prof. Ron Cohen (U.C. Berkeley)
- Reza Naima (U.C. Berkeley)
- Prof. Richard White (U.C. Berkeley)
In this research we highlight an important new shift in mobile phone usage – from communication tool to "networked mobile personal measurement instrument". We explore how these new “personal measurement instruments” enable an entirely novel and empowering genre of mobile computing usage called citizen science. Through the use of sensors paired with personal mobile phones, everyday people are invited to participate in collecting and sharing measurements of their everyday environment that matter to them.
Our research hypothesis is that this new usage model for mobile phones will:
- improve the science literacy of everyday citizens through active participation in basic scientific principles
- provide professional scientists with access to richer, finer-grain data sets for modeling and analysis
- create new experiences and usage models for the mobile phone as a tool for grassroots participation in government and policy making
- by choice of sensors and software create a deeper and more informed understanding and concern for our climate and environment - hopefully effecting positive societal change
Mobile phones are rapidly becoming the computer platform of choice in developed and developing nations. These mobile phones already shape our culture – collapsing space and time by enabling us to reach out to contact others at a distance, to perform just-in-time coordination of events, and to purchase, play, and game “on-the-go”. While there is a growing research space around sensor based activity inferencing and a wealth of existing location applications in the market, we claim that our mobile phones still fall short in their ability to enable us to measure and understand the real world around us.
We carry mobile phones with us nearly everywhere we go; yet they sense and tell us little of the world we live in.
Look around you right now.
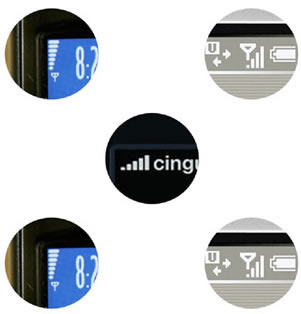
How hot is it? Which direction am I facing? Which direction is the wind blowing and how fast? How healthy is the air I’m breathing? What is the pollen count right now? How long can I stay outside without getting sunburned? Is the noise level safe here? Were pesticides used on these fruits? Is this water safe to drink? Are my children’s toys free of lead and other toxins? Is my new indoor carpeting emitting volatile organic compounds (VOCs)? Now look to your phone for answers about the environment around you. What is it telling you? For all of its computational power and sophistication it provides us with very little insight into the actual conditions of the atmospheres we traverse with it. In fact the only real-time environmental data it measures onboard and reports to you is a signal to noise value for a narrow slice of the electromagnetic spectrum (i.e. "how many bars do you have?").
Certainly, one could imagine accessing the web or other online resource from their mobile phone to find an answer to some of these questions. But much of that online data is calculated and published for general usage, not for you specifically. For example, the official weather station for a city may report that the temperature is currently 23ºC by taking one measurement at the center of the city or averaging several values from multiple sites across town. But what if you’re in the shade by the wind swept waterfront where it is actually 17ºC or waiting underground for the subway where it is a muggy 33ºC. The measurement that means the most to you is likely to be the one that captures the actual conditions you are currently experiencing, not citywide averages.
Imagine you are deciding between walking to one of two subway stations and could gather live data from the passengers waiting on the platform at each stop about the temperature and humidity of each station at that very moment? What if you were one of the 300 million people who suffer from asthma and could breath easily as you navigated your city with real-time pollen counts collected by your fellow citizens? What if you could not just be told the level of noise pollution in your city but measure and publish your own actual decibel measurements taken in front of your home? What if you were one of the more than 3 billion people, nearly half the world’s population, that burned solid fuels, including biomass fuels (wood, dung, agricultural residues) and coal, for their energy, heating, and cooking needs indoors and yet had no way to monitor the health effects of the resulting pollutants on yourself and your family even though nearly 2 million people die annually from indoor air pollution?
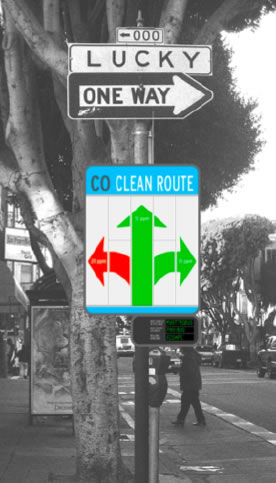
Mobile phones are allowing us to communicate, buy, sell, connect, and do miraculous things. However, we claim that this mobile technology, coupled with new sensing and software, can enable us to go beyond finding friends, chatting with colleagues, locating hip bars, and buying music. Our research aims to expand our perceptions of mobile phones as simply a communication tool and to research our envisioned understanding of them as personal measurement instruments capable of sensing our natural environment and empowering collective action through everyday grassroots citizen science across blocks, neighborhoods, cities, and nations.
Our near term goal is to build and study a series of mobile devices outfitted with novel sensors along with an infrastructure that provides public sharing and remixing of these personal sensor measurements by experts and non-experts alike. The overall long-term goal is to develop new communication paradigms that empower communities to produce credible information that can be understood by non-experts, in order to effect positive societal change.
Working with San Francisco Street Sweepers
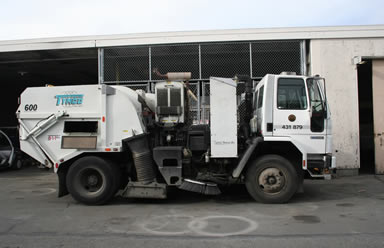
In a recent trial, we are collaborating with the City of San Francisco to put our air quality sensing systems on the municipal fleet of street sweepers. Street sweepers are vehicles that use mechanisms such as water sprays, brooms, and collection bins to clean debris from city streets. Our devices collect street-by-street air quality readings as the vehicles do their work, and the street sweepers have the key property that instrumenting a few vehicles provides both extensive and systematic coverage of the city.
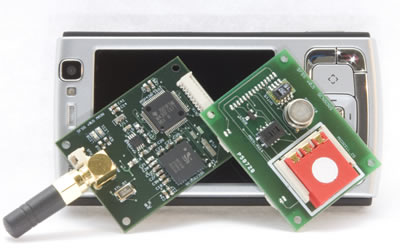
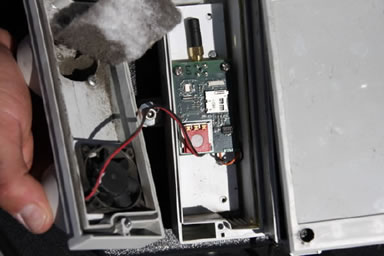
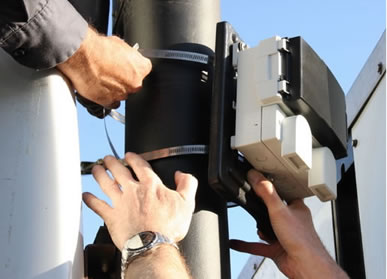
The street sweepers also offer us the opportunity to test and refine our system in a very challenging real-world environment. For example, there is the question of whether the emissions from the street sweeper affect the readings. We attach the enclosure to the front or top of the trucks to reduce that effect and we are planning studies to compare readings from our devices with readings taken a few meters away from the street sweepers in order to better calibrate our data and assess potential effects of emissions. Similarly, the street sweepers present challenges for enclosure design. The enclosure must ensure appropriate airflow to the sensors while simultaneously protecting the electronics against water, dirt, and physical hazards such as low-hanging tree branches. To address these issues, we have developed a robust enclosure split into two compartments. The first compartment contains the gas sensor board, a fan, air flow vents with baffles to minimize water intake, and drains for condensation. The second compartment is sealed and contains the main board and a mobile phone.
We have deployed our air quality sensing system on over half the fleet of street sweepers and are currently collecting CO, NOx, O3, temperature and humidity data. These sensor readings plus GPS data are sent to a database server via GSM text messages. This provides daily readings of air quality from across the city.
As we have been installing and tuning the system we have collected several months of data from these sweepers. Our plan is to make the data publicly available to everyone and we will be launching a website soon which will provide acess to live and historical data from this deployment. We have already developed several web-based visualization tools to interact with this data (see image and videos below). However, the website will also provide online community features to support discussion of interesting phenomena and strategies for practical action.
Our research is continuing and more sensor depolyments are planned. If you would like to get involved, learn more, want to have your city participate, or be included in our study, please contact us. We are praticularly interested in working with a range of community groups to develop additional applications.
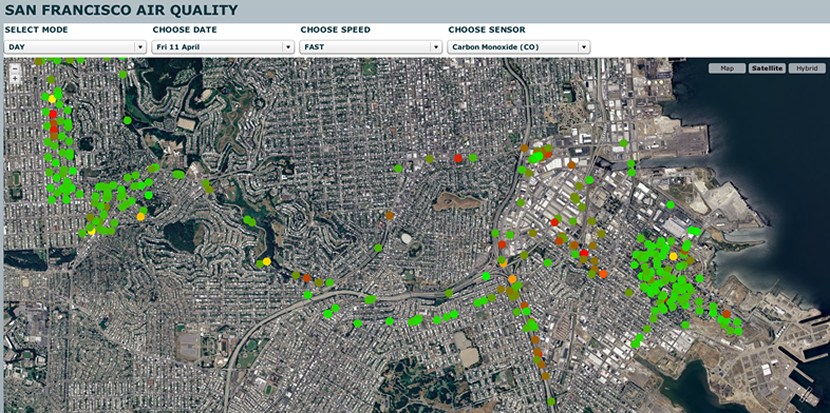
| SWEEPER VIDEO 1 - FIXED MAP | SWEEPER - OZONE READINGS |
| SWEEPER VIDEO 2 - INTERACTIVE MAP | SWEEPER - TEMPERATURE TEMPERATURE |
| SWEEPER VIDEO 3 - MAY STYLES |
FAQ
What are you sensing?
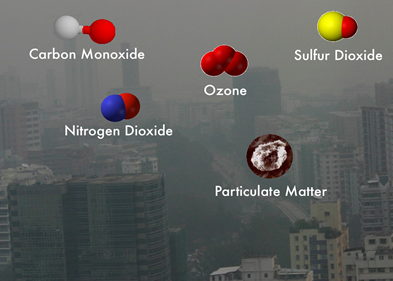
The sensors are commercially available gas sensors for sensing carbon monoxide (CO), NOx, and Ozone (O3). We also have sensors for temperature and humidity. We have integrated them into a custom board we designed and fabricated.
How do you transmit the data?
The data is sampled evey 60 seconds and sent from the board via bluetooth to the phone. From there we send the data via SMS along with the GPS data from the phone to a central server where it can be rendered into the visualization.
When can I get one?
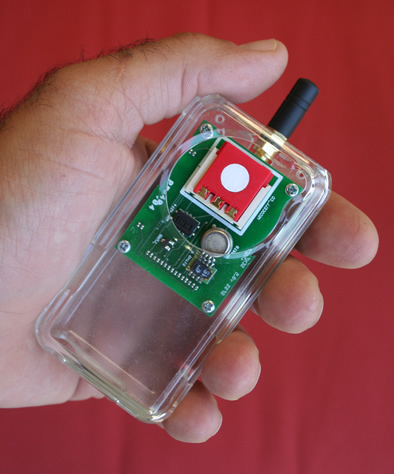
This is a research project and as such we are not planning on producing commercially avialble products yet. We are providing several handheld versions of the system for user studies and trials as part of the research effort. Please let us know if you have any interest in being part of future studies with this hardware?
So what have you discovered? How bad is my neighborhood?
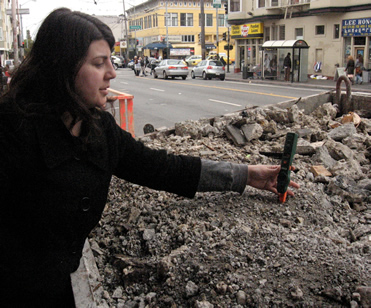
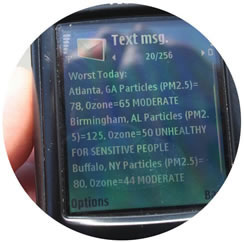
San Francisco is filled with microclimates and as a research project we are beginning to collect data to understand those effects. Some results are expected - slightly higher CO readings on highways, major thoroughfares, and industrial areas. Remember that this is a research project and even seeing a few high air pollution readings in a given neighborhood does not constitute a major health risk. We, along with the forward thinking leaders within the city of San Francisco government, are working to learn more about urban air quality and the promise of future technologies to improve our health. We are at the very early learning stages of this work with much excitement still to come. Jumping to premature conclusions now with our first set of data would almost certainly be detrimental to the larger goals of truly networked, on-the-go citizen science. High readings can be a result of high gas concentrations, sensor error, sensor drift, calibration error, a passing diesel bus, or exhaust from the street sweeper itself (although most of our sensors are mounted on San Francisco’s newest CNG clean air street sweepers and all of them mounted downwind from any exhaust). It is primarily over time that we expect larger patterns to emerge. In some sense the sweepers are the daily workhorses that pass through the city and gather data. When they record irregularly high readings, people (perhaps that live or travel through the neighborhood of concern) could be prompted to take further readings with a mobile phone based version of the system we have also developed (see image at left). One of the primary challenges is to create credible data and as such we have invested a considerable about of our effort towards that endeavor. Without credible data it will be difficult to meet our research goals of accessible citizen science.
Why are you doing this in San Francisco rather than in ___________ where pollution is a real problem?
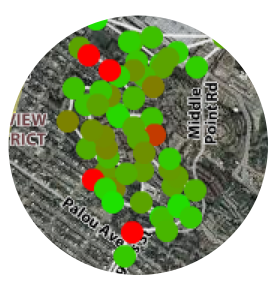
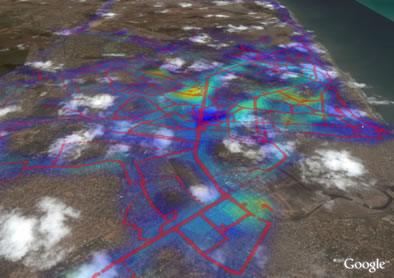
Again, this is a research project and we are largely understanding the challenges of a real world deployment in a site closer to home for debugging. Also realize that even learning how air quality varies acorss a city with relatively clean air is very important to our research. Previously we also completed a study where we collected two weeks of environmental data from taxicabs and people moving across the city of Accra, Ghana in Africa that illustrates a wide range of air quality fluctuations far into the unhealthy range. At left is a heat-map visualization of carbon monoxide readings from that study where colors represent individual intensity reading of carbon monoxide during a single 24-hour period across the city. Red circles are locations were actual readings were taken. We would like to study many other locations moving forward from this successful deployment. Please let us know if you have ideas to add to our list.
How do I get the data?
We will be making the data available soon and will make an announcement at that time. You should check the main Common Sense project website for updates. You can also subscribe to the mailing list below. Again, thank you for your interest in our work. In the mean time we have designed an SMS tool called Ergo, that allows you to access EPA readings from anywhere across the country.
We have a book chapter in press now further detailing this work. Look for it Fall 2008....
Citizen Science: Enabling Participatory Urbanism
Eric Paulos, R.J. Honicky, and Ben Hooker
Handbook of Research on Urban Informatics: The Practice and Promise of the Real-Time City.
Hershey, PA: Information Science Reference, IGI Global.
Edited by Marcus Foth, IGI Global, 2008 (in press)
Also check out Ergo a text messaging system we designed that is accessible now to everyone for receiving air quality reports from the EPA
Related Work
A collection of several inspirational projects:
Urban Sensing (CENS / UCLA)
SensorPlanet (Nokia)
AIR (Preemptive Media)
SenseWeb (Microsoft)
The Urban Pollution Monitoring Project (Equator UK)