Ergo
On-the-Go Air Quality Readings delivered to your mobile device
(415) 624-667X (number inactive)
Urban Atmospheres new research effort into Participatory Urbanism explores a people centric view of measuring, sharing, and discussing our environment and air quality using mobile devices such as your personal mobile phone with various air quality sensors attached. As we begin to build hardware and tools to empower this new usage model, we also present a series of important complementary tools and resources. In this case, we have designed Ergo, a simple SMS system that allows anyone with a mobile phone to quickly and easily explore, query, and learn about their air quality on-the-go with their mobile phone. We invite everyone to participate. We hope that you will find the experience enlightening. Please let us know your experience, thoughts, uses, etc by emailing us.
We will be rolling out new environmental tools and services in the future. If you want to be advised please subscribe to the Urban Atmospheres mailing list.

Urban air quality measurments taken via test tubes mounted to utility polls
Why Air Quality?
Do you know what the air quality is where you are right now? Now you can receive real-time air quality measurements throughout the United States on your mobile phone. Just send a text message to the phone number above and you will receive the most recent EPA air quality measurement data available. You'll be able to see the air quality change throughout the day as well as forecasts for the coming days.
Compare your air quality to other locations, request daily scheduled reports. All personally delivered to your mobile device while you're on-the-go. Below is a brief description of all of the sms commands you can send and what will be sent back to your phone. Further details on the information contained in the messages is also provided below.
Using Ergo
If you text...
- a 5 digit zip code = you receive the most recent air quality reports for that area (ex. 94704)
- the word worst = you receive the worst three locations in the US as currently reported (ex. worst)
- daily zip time = you receive a report every day at the specified time for the given zip code. The time should be in 24-hour format and uses the time zone associated with the zip code given. (ex. daily 10011 1300) for daily air quality for New York City at 1pm Eastern Time
- daily worst time = you receive a report every day at the specified time of the worst air quality in the United States. The time should be in 24-hour format and interprets the time as Pacific Time Zone. (ex. daily worst 0900 ) for daily report of worst air quality at 9am Pacific Time
- daily off = stops all daily messages sent to you

Eric Paulos in front of civic air quality measurement station in downtown Manchester, UK
How to Interpret the Air Quality Reports
There are two different reports that you can receive. When you request the air quality for a given zip code you will receive back a message such as the one below (this is the actual air quality report for Bakersfield for 4 June 2007).
Air Quality Index Bakersfield, CA
Currently @3:00 PM = 47 (GOOD) Ozone
6/4: 95 (MODERATE) Ozone
6/5: 124 (UNHEALTHY FOR SENSITIVE PEOPLE) Ozone
The system reports back the name of the city and the most recent data it is using to report the current condition. In this example @3:00PM, the Air Quality Index for Ozone is reported to be 47 for Bakersfield, California. Ozone is listed to tell you that the reading is for what is considered the major contributing pollutant for the day. At other times and places the Air Quality Index may be attributed to Particulate Matter as the major contributing pollutant and will be listed as such.
The Air Quality Index (AQI) is a standardized indicator of the air quality in a given location. It measures mainly ground-level ozone and particulate matter (i.e. small particles in the air), but may also include sulphur dioxide, and nitrogen dioxide. Various agencies around the world measure such indices, though definitions vary. In the US the Environmental Protection Agency (EPA) uses the following AQI classification:
| Air Quality Index (AQI) Values |
Levels of Health Concern | Colors |
|---|---|---|
| When the AQI is in this range: |
...air quality conditions are: | ...as symbolized by this color: |
| 0 to 50 | Good | Green |
| 51 to 100 | Moderate | Yellow |
| 101 to 150 | Unhealthy for Sensitive Groups |
Orange |
| 151 to 200 | Unhealthy | Red |
| 201 to 300 | Very Unhealthy | Purple |
| 301 to 500 | Hazardous | Maroon |
The level of health concern from above is also included in the sms message returned to you to aid in interpretation.
Ergo also typically provides you with two days of forcast air quality for the zip code provided. In this example, the high for 4 June was predicted to be 95 while it is currently down from that level later in the day. Similiarlly, 5 June is predicting 124 which is considered unhealthy for sensitive groups.
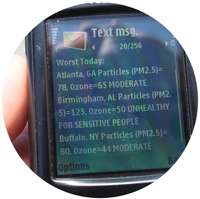
The other message type you can receive back is a listing of up to three of the worst air quality reporting locations in the US. Below is an actual report from 1 June 2007
Worst Today:
Atlanta, GA Particles (PM2.5)=78, Ozone=65 MODERATE
Birmingham, AL Particles (PM2.5)=125, Ozone=50 UNHEALTH FOR SENSITIVE PEOPLE
Buffalo, NY Particles (PM2.5)=80, Ozone=44 MODERATE
The message will contain the name of each city followed by its two primary pollutants. In the example above Atlanta, Georga is reporting PM2.5=78 AIQ and Ozone=65 AQI. Particulates, alternatively referred to as particulate matter (PM), aerosols or fine particles, are tiny particles of solid or liquid suspended in a gas. PM2.5 represents particles less than 2.5 micrometres in diameter. Larger particles are generally filtered in the nose and throat and do not cause problems, but particulate matter smaller than about 10 micrometres, referred to as PM10, can settle in the bronchi and lungs and cause health problems. Ozone referes to ground level Ozone. An overall health assemespt using the larger of the two AQI readings is given at the end of each entry, MODERATE for the Atlanta example.
Credits
Sources
The SMSAir tool uses the US Government's EPA site airnow.gov and the weather.weatherbug.com site as data sources.