![]()
TESTING ...
![]()
THIS IS NOT A SIMULATION
![]()
A one night event held on Thursday 27 October 2005 San Francisco Museum of Modern Art, San Francisco, CA
Eric Paulos
(Intel Research)
Anthony Burke (UC Berkeley)
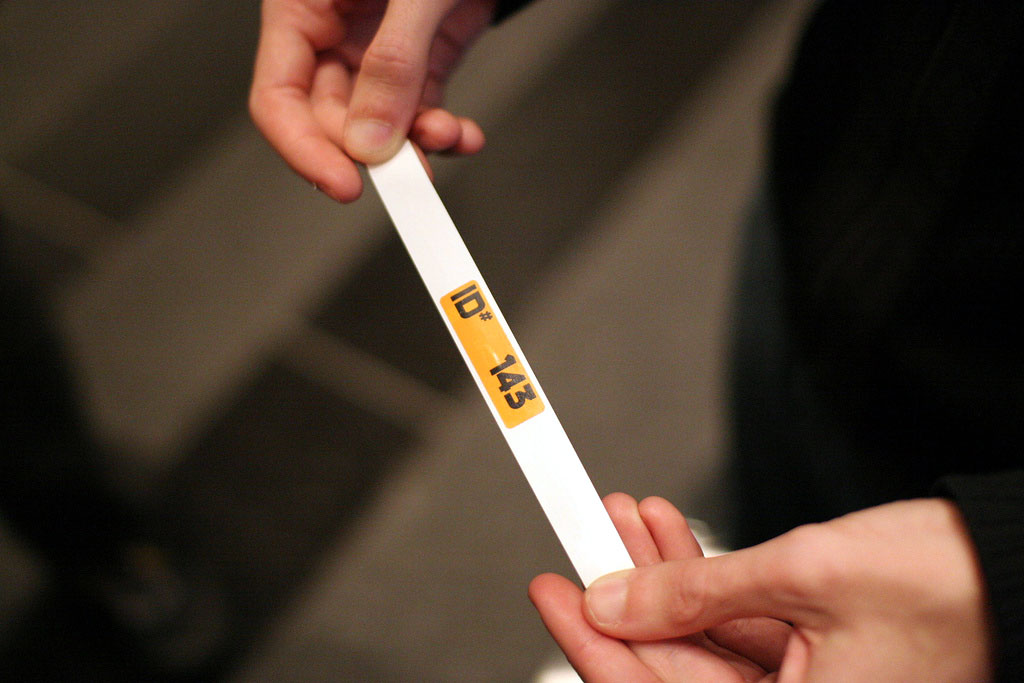
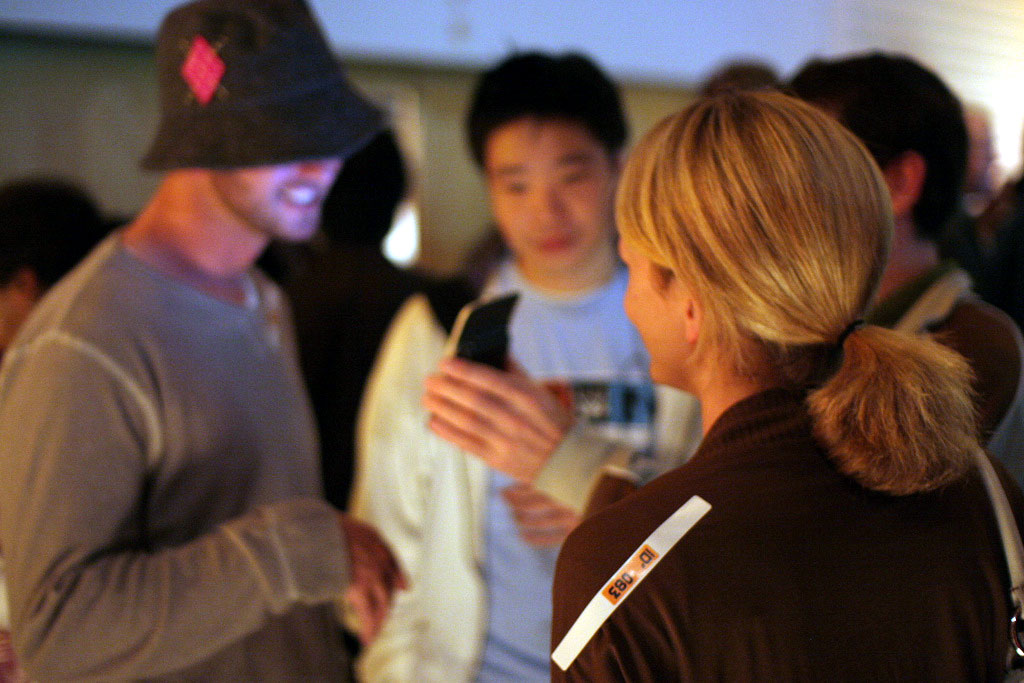
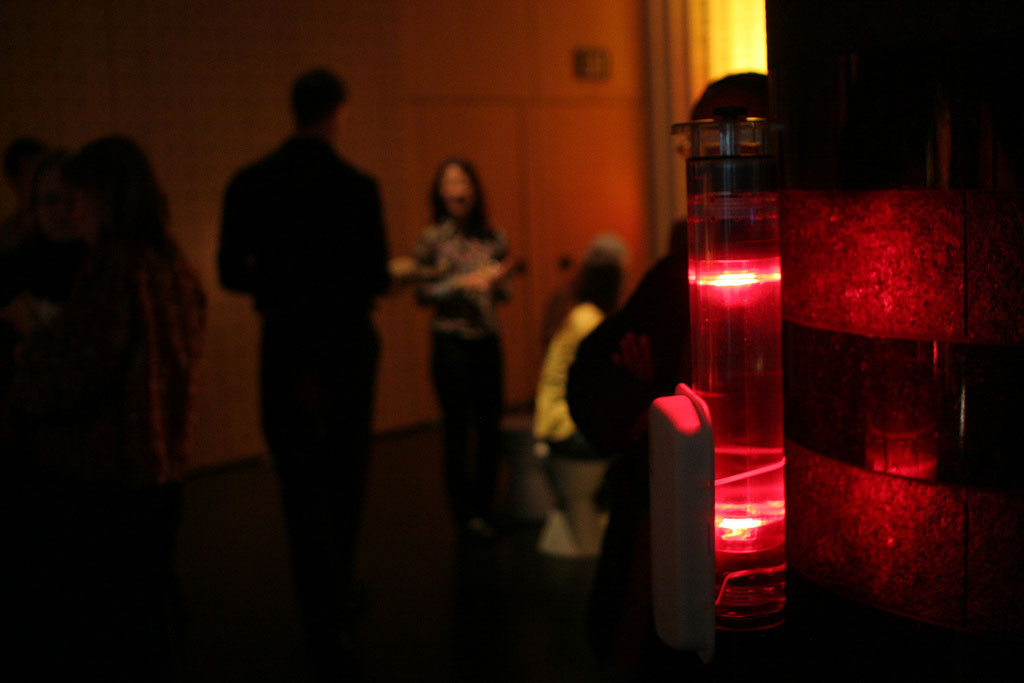
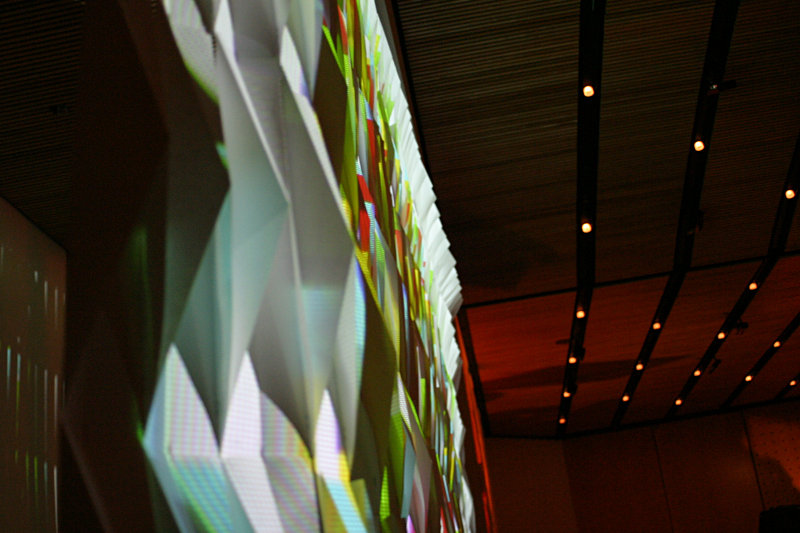
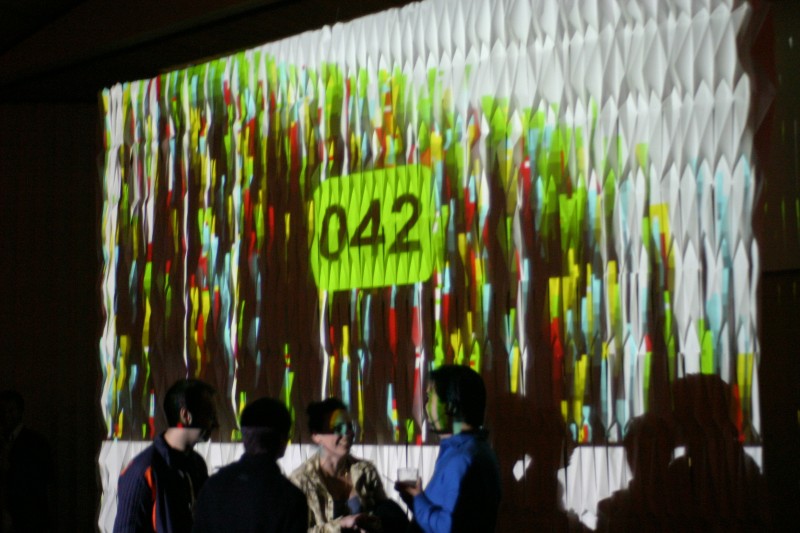
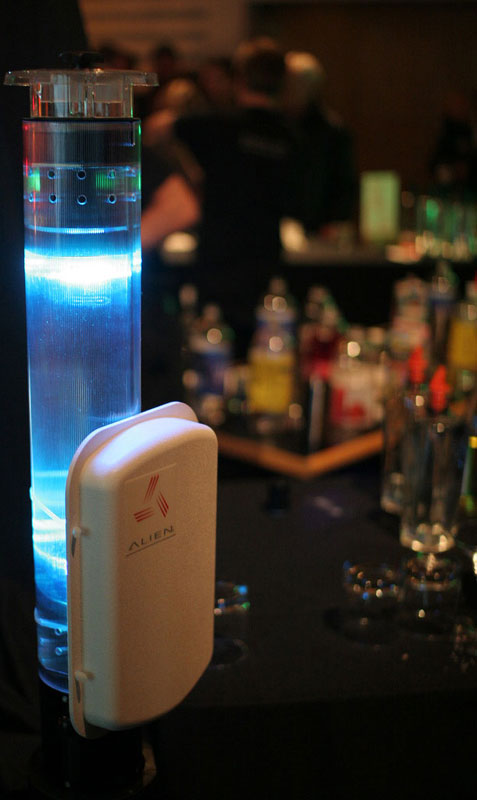
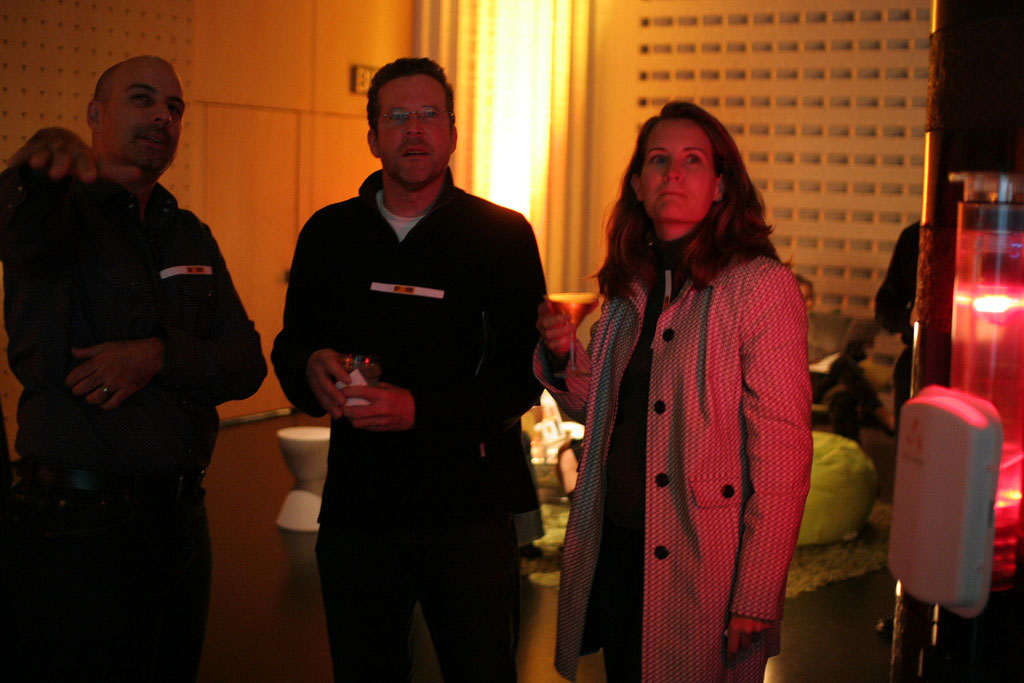
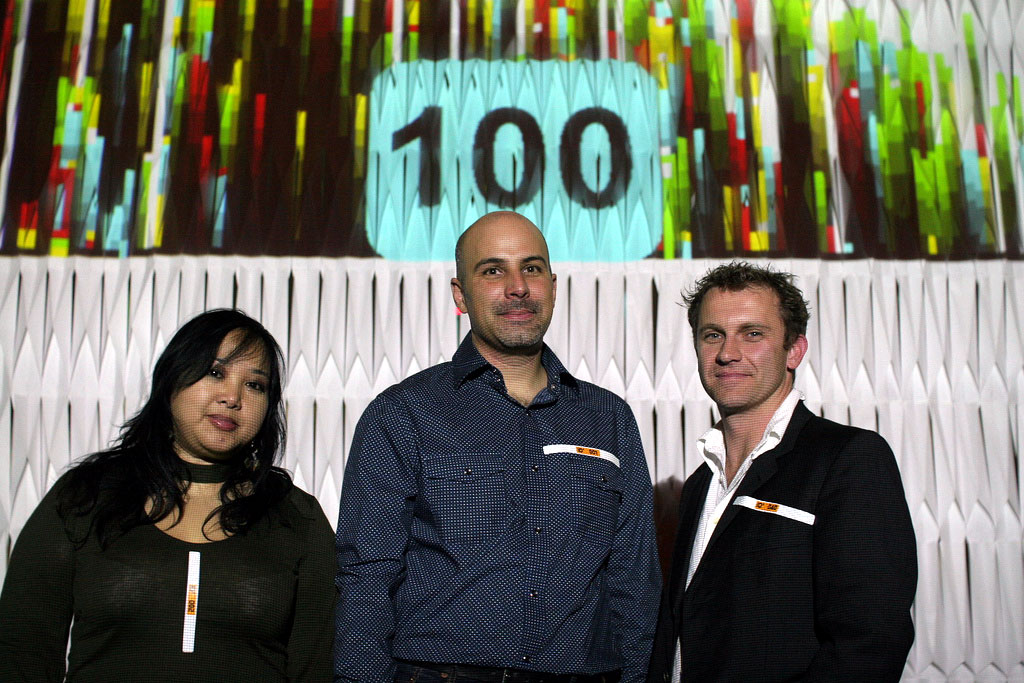
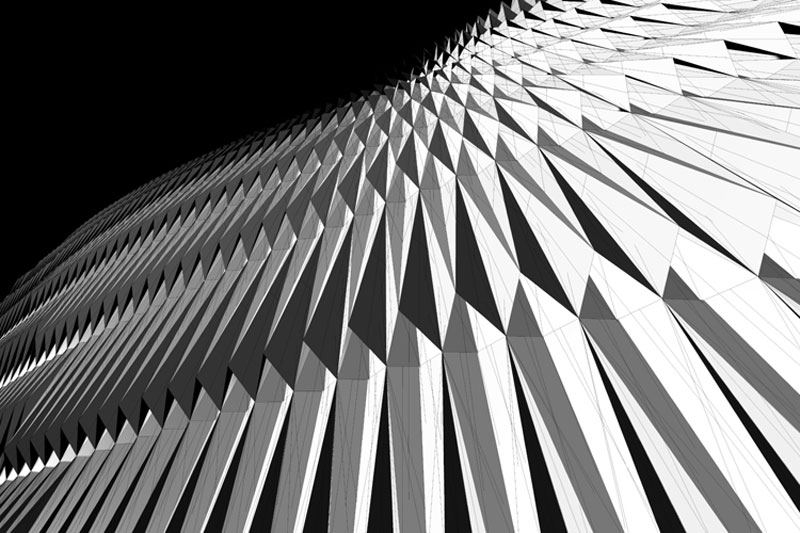
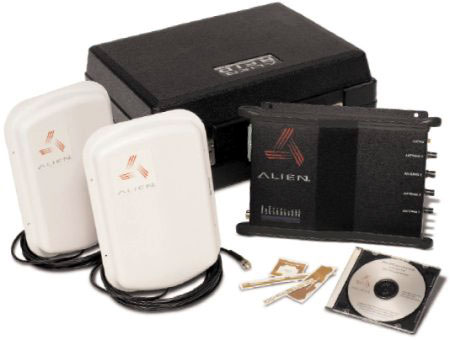
David Ross (UC Berkeley). TEASER Where are we? Locative media, GPS in car navigation, and the barrage of emerging location technologies are upon us? Somehow more than ever we find ourselves lost in the sea of longitudes and latitudes. A new wireless numerology? We invite you to thrust yourself within a space where mobs, crowds, tuples, and even the wallflower are active participants in a delicious interactive architecture of interwoven patterns. Tags, RFID, and tessellated surfaces thrust themselves into a feedback system generously lubricated by alcohol. DETAILS This installation explores the difference of statistically projected behaviors through an over-mapping with actual behavior. Using RFID tags and a range of antennas each corresponding to a particular behavioral zone, the group and individual behavior of participants at an event is tracked, logging in event statistics, such as an individuals duration of stay, time of entry, and favored geographic locations (near the bar, the lounge etc). A corresponding event specific set of forecasted data is used to geometrically construct a tessellated screen that indicates where average behaviors should occur, through the scale of the tessellations and 3 dimensional depth of the surface. During the actual event, people can track themselves through their unique RFID number, with their location and time information projected onto the screen in real time, creating a cross referencing of real and forecast information, that is highly event and location specific. This installation was first presented at the San Francisco Museum of Modern Art in October 2005. VIDEO Watch a video of the event and installation - 1:40mins (Quicktime)... Small 9.6mb... Large 30.6mb Video by Jill Miller editing by Tom Jenkins
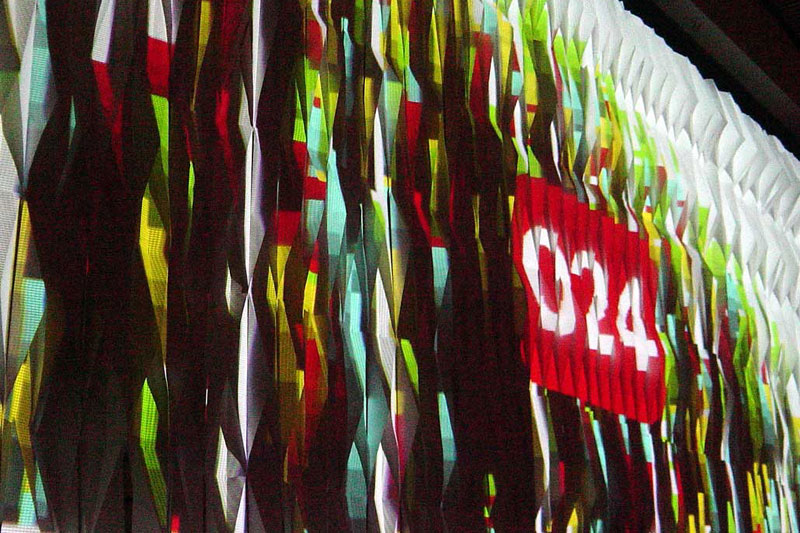
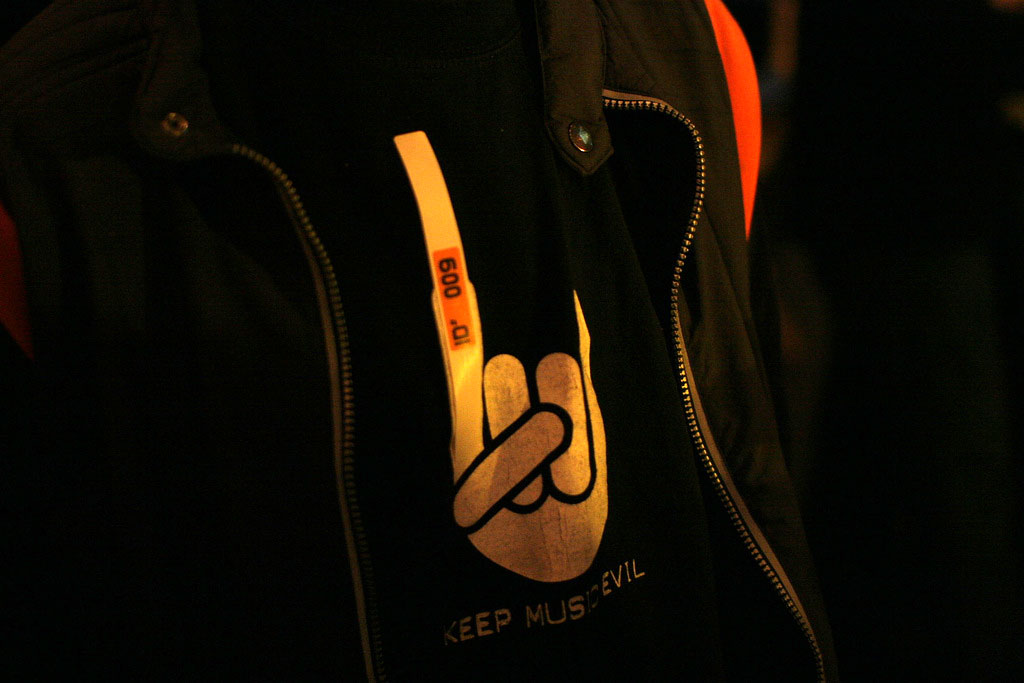
Images from the event... click on
thumbnails to enlarge
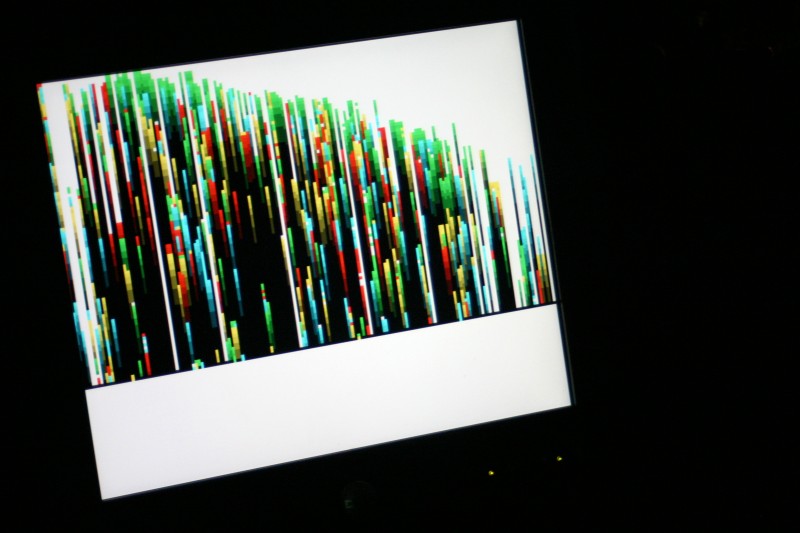
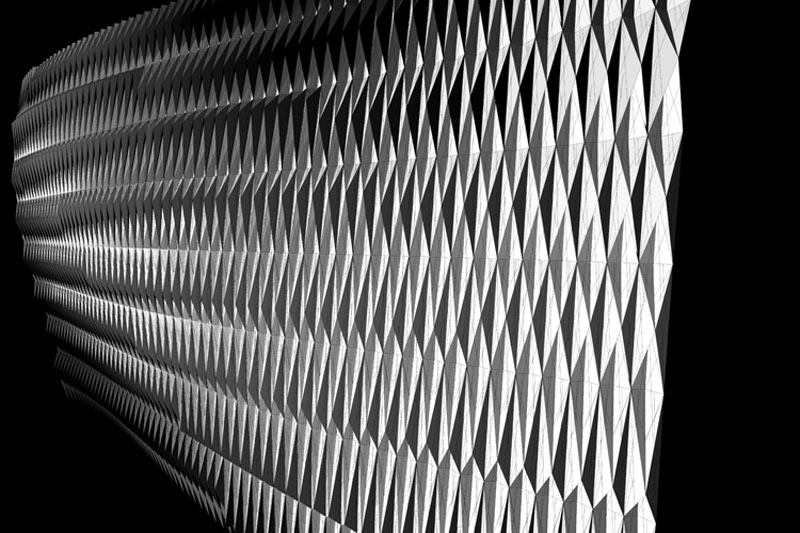
Visualizations of the tessellated projection screen... click to enlarge
PRESS No Place to Hide at RFID Tracking Party by Declan McCullagh in CNET News October 2005
|
||||||||||||||||||||